
The Pretty Links dashboard is the first thing you see when you click Pretty Links in your WordPress admin menu. It gives you an at-a-glance view of how your links are performing.
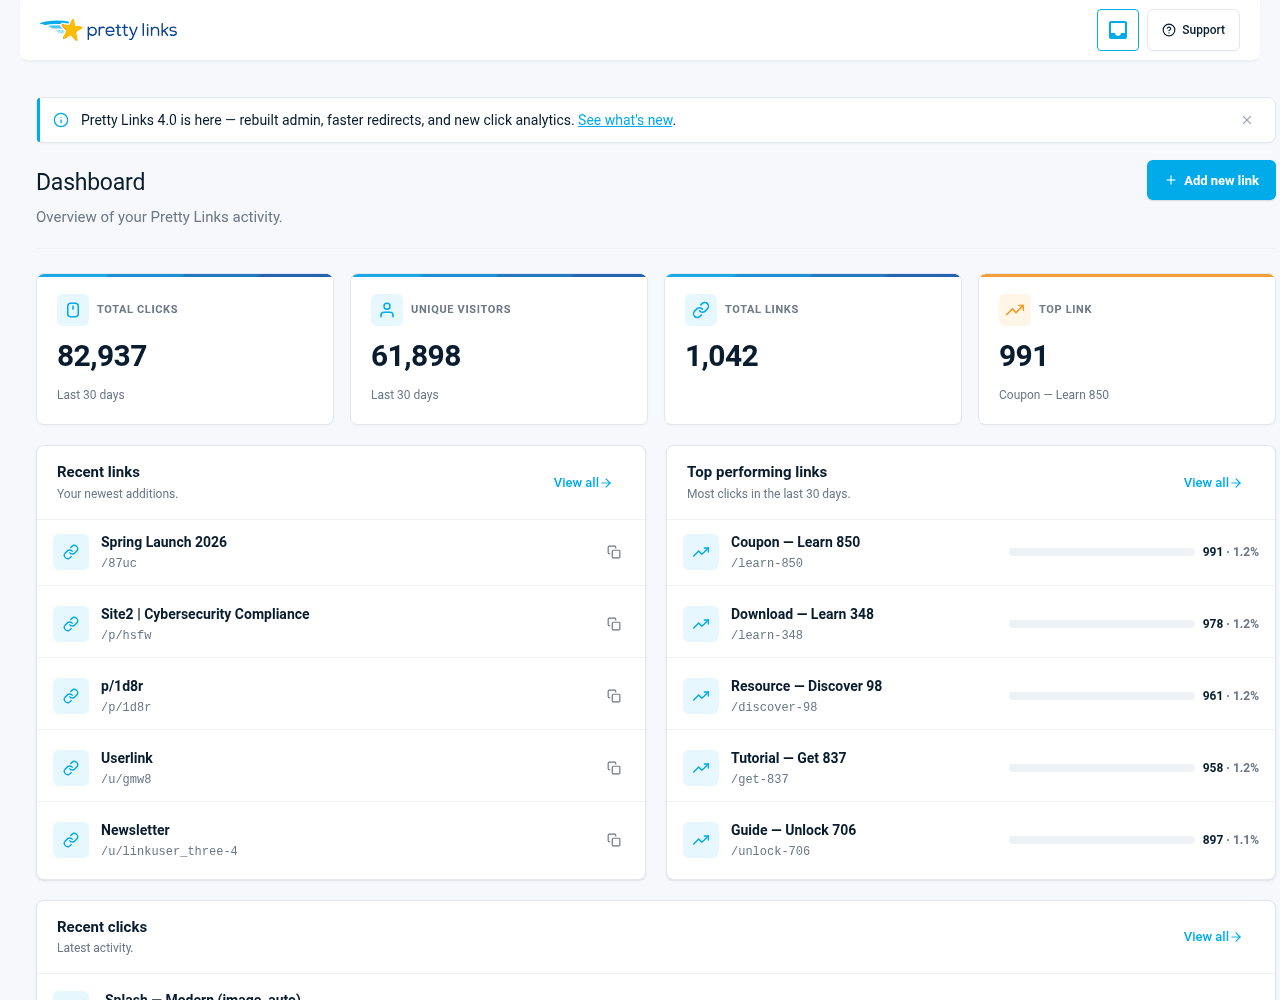
KPI Tiles
Across the top of the dashboard, you’ll find a row of tiles showing the headline numbers:
- Total Links — How many active pretty links you have on the site;
- Clicks — Click count across all your links over the last 30 days;
- Unique Visitors — Distinct visitors over the last 30 days;
- Average per day — Average daily click rate over the same 30-day window.
The KPI tiles refresh whenever you load the dashboard.
30-Day Overview
The dashboard shows a fixed 30-day overview. There’s no date-range picker on this page — for arbitrary date ranges, drill into Click History which has its own filters.
The Recent Links and Recent Activity feeds further down the page are chronological and intentionally not date-filtered.
Simple-Mode Dashboard
In Simple tracking mode, the dashboard switches to a stripped-down layout: total clicks and total uniques (lifetime, since Simple stores no timestamps), total links, and a top-performing-links card. There are no time-series charts, no recent-clicks feed, and the 30-day window doesn’t apply because Simple counters carry no dates.
Recent Links
The Recent Links panel lists the links you’ve created most recently, with their slugs, target URLs, and click counts. Click any link to jump straight to its edit screen or its detailed click history.
This is a quick way to keep an eye on links you’ve just shared — for example, the one you posted to your newsletter this morning.
Top Performers
The Top Performers panel ranks your links by click count over the same 30-day window as the KPIs. It shows you which campaigns, products, or shares are getting the most engagement.
Hover over any row to see the full target URL, or click the link to open its detail page.
A few ways to use this panel:
- Spot which affiliate offers are converting and which need a refresh;
- Find your most-shared content so you can double down on similar topics;
- Identify low performers that might be worth retiring or repointing.
Recent Activity
The Recent Activity feed shows the last clicks across your entire site, in reverse chronological order. Each entry includes:
- The link that was clicked;
- When the click happened;
- The visitor’s location (subject to your privacy settings);
- Whether the visitor was new or returning.
It’s a real-time pulse of what’s happening with your links right now. If you’ve just emailed a newsletter, you can watch the clicks roll in.
Jumping Deeper
Most panels on the dashboard are clickable shortcuts:
- Click a KPI tile to drill into the related report (a Pretty Links Pro feature);
- Click a link name to jump to its edit screen;
- Click a click count to open that link’s full click history;
- Click View All at the bottom of any panel to see the complete list.
For full filtering, search, and CSV export of click data, head to Dashboard > Pretty Links > Click History. See Click History for details.
Customizing What You See
Some dashboard panels respect the click tracking mode you’ve chosen. If you’ve set tracking to Simple, for example, you’ll see click counts but not visitor-level activity, since that data isn’t being recorded.
Switch tracking modes at Dashboard > Pretty Links > Options > Reporting.