
Das Pretty Links-Dashboard ist das Erste, was Sie sehen, wenn Sie darauf klicken Pretty Links in Ihrem WordPress-Admin-Menü. Dort erhalten Sie auf einen Blick einen Überblick über die Leistung Ihrer Links.
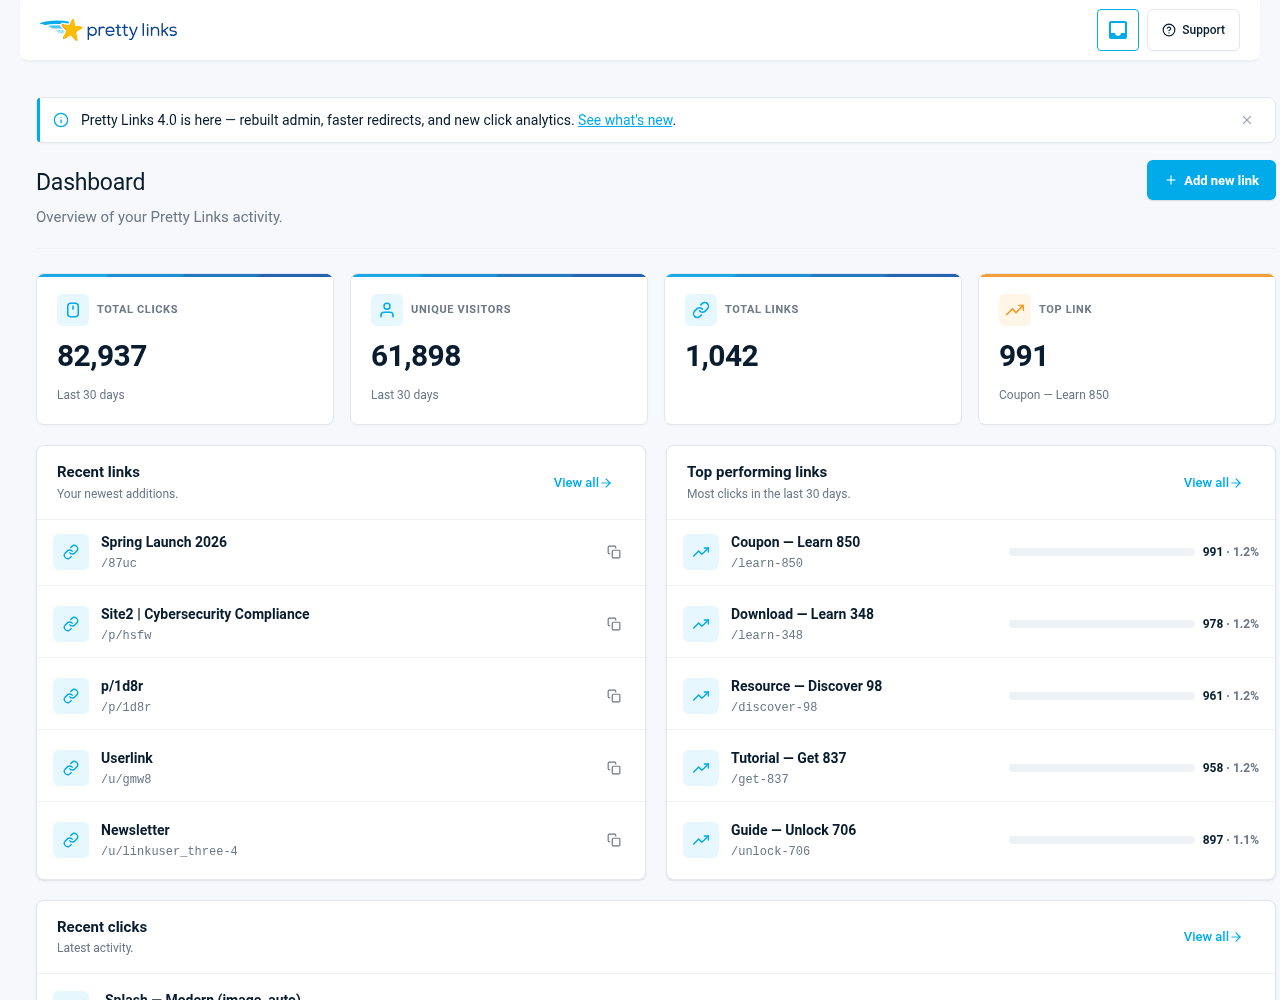
KPI-Kacheln
Am oberen Rand des Dashboards finden Sie eine Reihe von Kacheln, die die wichtigsten Kennzahlen anzeigen:
- Gesamtzahl der Links — Wie viele aktive „Pretty Links“ gibt es auf der Website;
- Klicks — Anzahl der Klicks auf alle Ihre Links in den letzten 30 Tagen;
- Einzigartige Besucher — Einzigartige Besucher in den letzten 30 Tagen;
- Durchschnitt pro Tag — Durchschnittliche tägliche Klickrate im gleichen Zeitraum von 30 Tagen.
Die KPI-Kacheln werden bei jedem Laden des Dashboards aktualisiert.
30-Tage-Übersicht
Das Dashboard zeigt einen festen 30 Tage Übersicht. Auf dieser Seite gibt es keine Auswahlfunktion für Datumsbereiche – für beliebige Datumsbereiche klicken Sie bitte auf Klickverlauf das über eigene Filter verfügt.
Die Feeds „Letzte Links“ und „Letzte Aktivitäten“ weiter unten auf der Seite sind chronologisch sortiert und bewusst nicht nach Datum gefiltert.
Dashboard im einfachen Modus
Unter Einfacher Tracking-Modus, wechselt das Dashboard zu einem reduzierten Layout: Gesamtzahl der Klicks und Gesamtzahl der Unique-Besucher (seit Bestehen, da Simple keine Zeitstempel speichert), Gesamtzahl der Links sowie eine Karte mit den leistungsstärksten Links. Es gibt keine Zeitreihendiagramme, keinen Feed mit den jüngsten Klicks, und das 30-Tage-Fenster findet keine Anwendung, da die Zähler von Simple keine Datumsangaben enthalten.
Aktuelle Links
Die Aktuelle Links In diesem Bereich werden die zuletzt von Ihnen erstellten Links mit ihren Slugs, Ziel-URLs und Klickzahlen aufgelistet. Klicken Sie auf einen beliebigen Link, um direkt zum Bearbeitungsbildschirm oder zum detaillierten Klickverlauf zu gelangen.
So können Sie ganz schnell die Links im Blick behalten, die Sie gerade geteilt haben – zum Beispiel den, den Sie heute Morgen in Ihrem Newsletter gepostet haben.
Spitzenreiter
Die Spitzenreiter Das Dashboard ordnet Ihre Links nach der Anzahl der Klicks im gleichen 30-Tage-Zeitraum wie die KPIs. Es zeigt Ihnen, welche Kampagnen, Produkte oder Beiträge das größte Engagement erzielen.
Bewegen Sie den Mauszeiger über eine beliebige Zeile, um die vollständige Ziel-URL anzuzeigen, oder klicken Sie auf den Link, um die Detailseite zu öffnen.
Einige Möglichkeiten, dieses Bedienfeld zu nutzen:
- Ermitteln Sie, welche Affiliate-Angebote zu Conversions führen und welche überarbeitet werden müssen;
- Finden Sie Ihre am häufigsten geteilten Inhalte, damit Sie sich verstärkt auf ähnliche Themen konzentrieren können;
- Ermitteln Sie Komponenten mit geringer Leistung, bei denen eine Außerbetriebnahme oder eine Neuausrichtung sinnvoll sein könnte.
Aktuelle Aktivitäten
Die Aktuelle Aktivitäten Der Feed zeigt die letzten Klicks auf Ihrer gesamten Website in umgekehrter chronologischer Reihenfolge an. Jeder Eintrag enthält:
- Der Link, auf den geklickt wurde;
- Als es „klick“ machte;
- Der Standort des Besuchers (vorbehaltlich Ihrer Datenschutzeinstellungen);
- Unabhängig davon, ob es sich um einen neuen oder einen wiederkehrenden Besucher handelte.
So erhalten Sie einen Echtzeit-Einblick in das aktuelle Geschehen rund um Ihre Links. Wenn Sie gerade einen Newsletter per E-Mail verschickt haben, können Sie beobachten, wie die Klicks hereinströmen.
Tiefer eintauchen
Die meisten Felder auf dem Dashboard sind anklickbare Verknüpfungen:
- Klicken Sie auf eine KPI-Kachel, um den zugehörigen Bericht aufzurufen (eine Funktion von Pretty Links Pro);
- Klicken Sie auf den Namen eines Links, um zum Bearbeitungsbildschirm zu gelangen;
- Klicken Sie auf eine Klickzahl, um den vollständigen Klickverlauf dieses Links zu öffnen;
- Klicken Sie auf Alle anzeigen am unteren Rand eines beliebigen Fensters, um die vollständige Liste anzuzeigen.
Um Klickdaten umfassend zu filtern, zu durchsuchen und als CSV-Datei zu exportieren, gehen Sie zu Dashboard > Pretty Links > Klickverlauf. Siehe Klickverlauf Weitere Informationen.
Anpassung der Anzeige
Einige Dashboard-Felder berücksichtigen die Klick-Tracking-Modus das Sie ausgewählt haben. Wenn Sie die Nachverfolgung auf Einfach, … werden beispielsweise die Klickzahlen angezeigt, nicht jedoch die Aktivitäten auf Besucherebene, da diese Daten nicht erfasst werden.
Wechseln Sie den Verfolgungsmodus unter Dashboard > Pretty Links > Optionen > Berichterstellung.