
Disponível no plano Super Affiliate.
Uma página de boas-vindas é um funil: o visitante chega → vê a página de boas-vindas → realiza alguma ação (clica, é redirecionado automaticamente ou sai do site) → chega ao destino. O relatório do funil mostra exatamente o que está acontecendo em cada etapa, para que você saiba se a sua página de boas-vindas está funcionando — e não apenas se o link está sendo clicado.
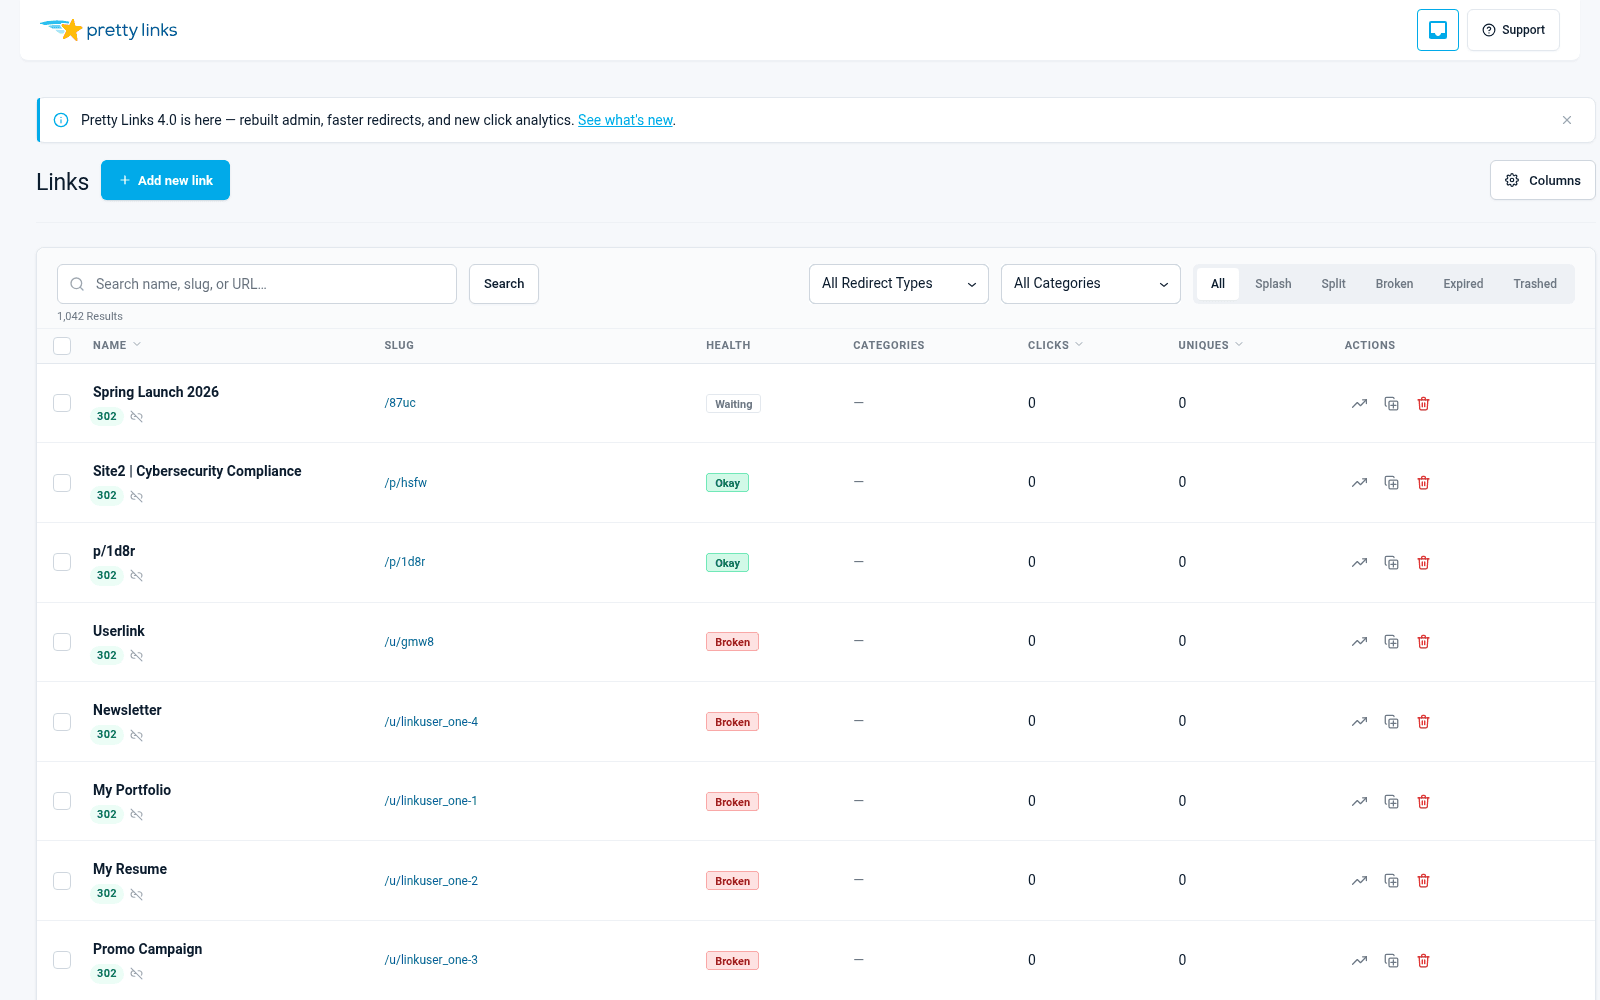
Onde encontrar
Em Painel > Links simplificados > Todos os links, observe qualquer linha cujo tipo de redirecionamento seja “Splash”. Você verá um pequeno ícone de gota nessa linha. Clique no ícone do gotinho para abrir o relatório do funil dessa página de boas-vindas.
(Os links “Splash” são os únicos que apresentam a gota — os redirecionamentos comuns não têm um funil, pois não há nada no meio para ser medido.)
O que você vê
O relatório de funil apresenta várias métricas, cada uma delas medindo uma etapa diferente da jornada do visitante.
Visualizações
O número de vezes que a página inicial foi carregada. Cada vez que alguém clica no link curto, esse contador aumenta em um.
Esse é o seu número da “parte superior do funil” — o alcance total.
Conversões do CTA1
O número de vezes que os visitantes clicaram no botão principal de chamada à ação. Essa é a métrica para a qual a maioria das páginas de boas-vindas é otimizada: o visitante realizou a ação que você desejava?
Conversões do CTA2
Se você tiver um CTA secundário configurado, este é o número de vezes que os visitantes clicaram nele.
Para telas iniciais do tipo “escolha seu destino”, as conversões de CTA1 + CTA2 indicam qual caminho os visitantes preferem. Para telas iniciais do tipo “inscrever-se / pular”, a comparação entre CTA1 e CTA2 mostra qual porcentagem seguiu o caminho de captura de leads e qual a ignorou.
Redirecionamentos automáticos
No caso de páginas iniciais configuradas para redirecionamento automático após um certo tempo, esse é o número de visitantes que aguardaram o término do tempo de espera e foram redirecionados automaticamente (sem clicar em um CTA).
Se a maior parte das suas conversões vier de redirecionamentos automáticos, em vez de cliques em CTAs, isso é um sinal de que suas CTAs não são atraentes — ou de que o redirecionamento automático está ocorrendo rápido demais para que os visitantes interajam.
Quicadas
O número de visitantes que acessaram a página inicial e saíram sem clicar em nenhum CTA e sem serem redirecionados automaticamente. As saídas incluem pessoas que fecharam a aba, clicaram no botão “Voltar” ou abandonaram a página de alguma outra forma.
Uma alta taxa de rejeição é o sinal mais claro de que algo está errado: texto confuso, carregamento lento do vídeo, expectativas não atendidas ou a página inicial não correspondeu ao que o link prometia.
Taxa de conversão
Uma métrica resumida: porcentagem de visualizações que resultaram em um clique no CTA (ou, no caso de telas iniciais com redirecionamento automático, um redirecionamento automático bem-sucedido para o destino).
Como ler o relatório
Alguns padrões a serem observados:
Muitas visualizações, baixas taxas de conversão do CTA1, alta taxa de rejeição. A página inicial não está cumprindo sua função. Ou o texto não é atraente, a página carrega muito devagar ou o visitante esperava outra coisa ao clicar no link. Experimente usar títulos diferentes, um modelo diferente ou um vídeo mais curto.
Muitas visualizações, altas taxas de conversão do CTA1. A página inicial está funcionando bem. Não mude o que está funcionando — mas pense se você poderia aumentar a taxa de conversão do CTA1 com um texto melhor.
As conversões do CTA1 e do CTA2 estão praticamente equilibradas. Uma página inicial do tipo “escolha seu destino”, na qual os visitantes se dividem de forma mais ou menos igual. Isso é positivo se a sua intenção era que ambas as opções fossem viáveis. Se o CTA1 for a meta “real” e o CTA2 for uma alternativa, uma divisão igual significa que o CTA2 está muito em destaque.
Alto índice de redirecionamentos automáticos e baixa taxa de conversão das CTAs em uma página inicial com acesso restrito. Espere — as telas iniciais com acesso restrito não deveriam redirecionar automaticamente de forma alguma. Se você estiver vendo isso, verifique novamente a configuração de comportamento da tela inicial.
Poucas visualizações. A página inicial não está sendo exibida porque o Pretty Link subjacente não está recebendo cliques. A página inicial não é o seu problema; o problema é a divulgação.
Iterando em um Splash
O relatório de funil transforma as páginas de impacto de um recurso do tipo “configure e esqueça” em algo que você pode otimizar. Um ciclo de iteração razoável:
- Envie a página inicial com suas melhores sugestões quanto ao modelo, ao texto e ao comportamento.
- Espere uma semana ou até ter pelo menos 100 visualizações.
- Abra o relatório do funil. Analise a taxa de conversão.
- Identifique a etapa mais fraca (alta taxa de rejeição? baixo CTA1?).
- Altere um elemento — título, modelo, comportamento, texto do CTA.
- Espere mais uma semana.
- Compare.
Fazer uma alteração por vez mantém a experiência bem definida. Várias alterações simultâneas tornam impossível saber o que funcionou.